Saturday, May 31, 2008

Red Sox vs Orioles, Lester vs Olson 5/31

After a nice extra inning win on the road yesterday, the Red Sox look to keep the winning ways going tonight in Baltimore. The Sox will be starting Jon Lester while the O's will be throwing Garrett Olson. We have looked at Jon Lester a lot already on this blog so let us take a look at Garrett Olson.


Olson is a lefty who was drafted #48 overall in the 2005 draft. He started 2008 in AAA but has been effective in his 33 innings of work this year for Baltimore. He is 4-1 with a 4.09 era and 26-13 K's to BB. In fact, he has actually pitched much better than his ERA indicates. The ERA is inflated due to a rocky start vs NYY on 5/21 in which he gave up 6 runs in 2.2 innings.
So what will he be throwing at Boston tonight?


Really just a three pitch guy. Fastball, changeup and slider. Slider has a long horizontal break that sweeps across the plate.

Below is his pitch type by count, broken down by batter hand:


Versus left handed hitters, he is mainly a fastball/changeup guy. Very little sliders to the lefty and will only use it when he gets ahead in the count. Versus right handed hitters he will throw that slider all day until he gets to three balls.

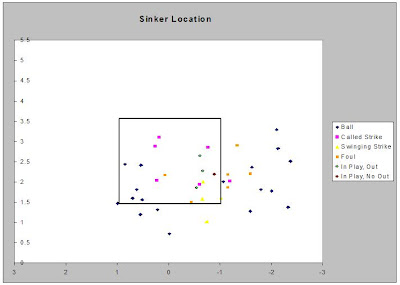
Here is his slider locations versus right handed hitters:


This chart is from the catchers view. He is trying to pound the zone down and in, but tends to leave some of the sliders over the heart of the plate. If he can keep that slider down tonight, expect him to be effective against a RH heavy lineup.

Before we finish up, here is Olson's release point for his fastball and changeup. I figured since he only throws lefties these two pitches, would a hitter be able to recognized the pitch from his release point? This data shows the difference, but I'm not sure how much of a difference it is for a hitter to be able to pick up on it.

From the catcher's view:

Quick note, the points that are in the oval are from his 5/21 start versus the Yankees where he got rocked. Three things could have happened: he was either working from a different part of the mound, his mechanics were off or the system was off. Either way, something was happening.

So back to the rest of his starts. You can see that his changeup comes more from the right of the graph. Would this mean he is extending his arm more when he releases that pitch compared to the fastball?

Now it is easy to sit here and see the difference. But we really don't know if it is visible to a hitter.

I am looking forward to watching Olson vs the Sox tonight. Should be a good one.

Friday, May 30, 2008

5/30 Pitcher Preview: Josh Beckett

Josh Beckett will go tonight for the Sox vs the O's and Daniel Cabrera. Beckett is coming off a good performance last time out vs Oakland in which he gave up 2 runs in 7 innings.


While Beckett's season to date might look discouraging to the casual viewer with a 5-4 record and a 4.43 ERA, there are many more encouraging signs in his perphials. His 31-3 strikeout to walk ratio over his past three games along with a 65-11 K:BB rate on the year is extremely impressive. In fact, look at these numbers from Fangraphs over the past three seasons:

K/9:
2006: 6.95
2007: 8.70
2008: 9.59

BB/9:
2006: 3.25
2007: 1.79
2008: 1.62

FIP: Predicted ERA based on peripherals
2006: 5.13
2007: 3.08
2008: 3.59

So with that said, where is he struggling? Three main things are leading to "presumed" lack of success this year:

HR/9: This is increased because of his fly ball percentage
2006: 1.58
2007: 0.76
2008: 1.48

FB%:
2006: 38%
2007: 37%
2008: 40%

LOB%: Needs to do a better job of stranding runners
2006: 69%
2007: 75%
2008: 68%

Overall, Beckett is settling down nicely after a rough first week of the season. Expect his ERA to drop and Wins to pile up as we move into summer. In fact, he can hold his peripherals and move his HR/9 number down to about 1.00, we can expect another run at the Cy Young award.

Below is Beckett's pitches from his 5/24 start vs Oakland. I am going to use the pitch type from Ross Paul's algorithm. This method is used to identify pitches on a real time basis, so its job is to get the majority of the pitches right and doesn't take into account each pitchers repertoire. With that said, Josh Beckett is a fairly easy pitcher to identify. He throws a 2 seam FB, a 4 seam FB, a curveball and a changeup. These charts don't split up the fastball, but that is nitpicking for a real time pitch identification system right now.


Thursday, May 29, 2008

Calculating league averages by pitch speed

So I am about to wrap up my calculations but I wanted to ask a question to the readers first. I am going to be posting the BABIP, Strike % and Contact % for all of MLB according to pitch speed. Currently, I have grouped the pitch speeds into 6 categories:

1. 95+
2. 90-94.9
3. 85-89.9
4. 80-84.9
5. 75-79.9
6. 60-74.9

Does anyone see a better way to group the speeds? I would like to do it by pitch type, but I don't have an algorithm to classify ever pitch in one go. For now, I figure this works. The 6th category is the largest range of speeds, but I figured with so little amount of pitches in that range, combined with the fact that those pitches are mostly curves and Jamie Moyer fastballs(kidding), it would make sense.

I will wait a day for any responses and then post the results after that.

Here is a quick tease:

95+ MPH
BABIP: 0.354
Strike %: 64.10%
Contact %: 81.98%

Thanks guys.

Wednesday, May 28, 2008

5/28 Pitcher Preview: Erik Bedard

Here is Erik Bedard according to Inside Edge and Baseball Info Solutions. Inside edge is from espn.com while BIS is from fangraphs: I am going to use 2007 data because the IE data on espn.com is for his whole career unfortunately and not just 2008


Very interesting to see just how much their numbers are off. I guess that goes to show how inaccurate it can be to chart pitches from television. The biggest concern I have with this data is how different the curveball percentages are. From my experience, curves are the easiest pitches to chart.

I will look at the pitch f/x data and update the post later tonight.

UPDATE: To see Bedard through pitch f/x, refer to this terrific article by Mike Fast from January.

To give an example of what Mike and I talked about in the comments, here is a quick look at spin angle vs speed:
Just from eyeballing that data, which is not broken down by pitch type, you can see three clear sets of data: Fastball which has the most speed, changeup which is the smallest set to the right and the curve ball to the left. If you look closely at the fastball data set, you can see the bottom left part of that is starting to break off from the rest of the points. That is the cutter Mike talks about.

Bedard is definitly not throwing a slider. The slider would show up around the 80-85 mph range with a spin angle around 150.

Hope that helps anyone who is wondering what the data looks like before it is dissected.

Sinker Release Points

After reading tonight's Cubs F/X post regarding Derek Lowe, it made me think about sinker ball pitchers. About a week ago while watching rookie Justin Masterson pitch, I decided to take a quick look at the release points of various known sinker ball pitchers around the league.


Three questions keep popping up for me when looking at these numbers.

1. Is this data skewed because of the various parks?
A: Yes it is. I don't know how much though. Josh Kalk would be able to explain better.

2. How much of this data is affected by differing mound heights at each park?
A: I asked Mike Fast this a couple weeks back and he basically said the errors in last years data had much more to do with park inconsistencies than mound height. This is an unknown area still waiting to be explored.

3. Is the release point data affected by where you stand on the mound?
A: I haven't read anything on this, but my guess would be yes. Some pitchers like to stand on the right of the rubber, others like to be off to the left. Some pitchers choose the rubber side based on the hitters hand. Has anyone done more work in this regard?

Lastly, if we can normalize all of this data, how much can teams, players and fans learn about release points? Will there be a time when we can look at a pitcher who is standing on the right side of the rubber and see that his breaking pitches would be more effective from the left side? Will we be able to evaluate release point data from a medical point of view? Will we be able to have a better understanding of arm slot in regards to injury history?

The great thing about looking at this data everyday is that you always find more questions you want answered. As Tom Tango said yesterday "You are all on the path to reach the pinnacle of sabermetrics". The more data that becomes available, the more questions that arise.

Isn't it wonderful?

Tuesday, May 27, 2008

Manny Ramirez vs Pitch Speed

So here is a quick look at Manny Ramirez vs various pitch speeds.


So what kind of conclusions can we draw from this chart? Well, until we calculate league average, not much. We can't know if this is good or bad. One thing I can say is that his contact percentage is fairly consistent vs pitch speed. I am looking forward to calculating the league averages at these various speeds to see just where Manny is on average.

My next two projects will be calculating league average at these various speeds and then doing some random players to see if anything jumps out.

With that said, does anyone have any stats that they would like to see?

Disclaimer: BABIP includes HR's. The BABIP is off from what fangraphs has because there are pitches that aren't tracked by Pitch F/X

Dice-K Pitch Cluster Update

Dice-K starts tonight in Seattle vs Miguel Batista. I have updated his pitch types.

After using a K-Means cluster, which I set at 6 pitches, here is the new pitch cluster. I believe this better represents his arsenal than the previous charts.


4FB=Blue
2FB=Purple
Cutter=Red
Slider=Light Green
Curve=Green
Changeup=Orange

Please note I believe the Blue and Purple are all one fastball. The algorithm assigned them as two separate pitches, but I'm not so sure. I would have expected there to be much more changeups/splitters, but that is all there is. Fangraphs lists Matsuzaka with throwing changeups or splitters for around 10 percent of his pitches. Josh Kalk's player card agrees with what I have for the amount of pitches thrown in that cluster: http://baseball.bornbybits.com/2008/Daisuke_Matsuzaka.html

Anyone have any other suggestions for trying to pin down what exactly he throws? Most scouting reports seem to vary on pitch type for him.

Monday, May 26, 2008

How did Joe Blanton beat the Red Sox?

After staring at the data for around two hours, I really can't put my finger on it. I'll post the numbers and if you can come up with anything, you let me know.

SEASON AVERAGE
Pitch Type Pfx_x Pfx_z Speed Spin Angle
FB -5.47 9.81 89 209
CB 5.59 -7.11 75 39
CH -6.58 6.52 82 225
CU -1.63 11.44 89 188
SL 5.35 4.56 82 131

MAY 25th vs Red Sox
Pitch Type Pfx_x Pfx_z Speed Spin Angle
FB -5.59 10.13 89 209
CB 4.05 -5.58 75 40
CH -6.83 6.58 82 226
CU -2.28 11.33 90 191
SL 5.12 0.72 80 98


Nothing really outside the norm here. His fastball moved to his glove side a little more than usual and his slider had less downward movement, but that isn't significant when you see the next chart.


Lots of called strikes on the fastball. For a pitch that doesn't get many swinging strikes (only 14 total on the year!), they shouldn't have been sitting on his other pitches so much. While the Red Sox like to work the counts, they should have looked to be more aggressive vs Blanton. In fact, they only swung at 12 of his 55 fastballs all day. On the other hand, they were clearly fooled when he threw his changeup. It was thrown 19 times and they swung 9 times, putting it in play 3 times for one hit.

To further back up my point on being more aggressive when he throws the fastball, both runs came off his fastball: The solo HR by David Ortiz in the first and the RBI single by Manny Ramirez.

The Red Sox will look to bounce back tomorrow, which shouldn't figure to be any easier. They face Felix Hernandez.

Sunday, May 25, 2008

Red Sox vs Joe Blanton

Joe Blanton will be taking the mound on Sunday vs the Red Sox. Blanton has been a subject of numerous trade rumors over the past two season as teams have tried to bolster their staffs. On a young team like the A's who will most likely slip out of the race come the summer, Blanton would seem like a perfect trade target for a contending team come July. Below is a look at what he brings each start:

Pitch Type Pfx_x Pfx_z Speed Spin Angle
FB -5.47 9.81 89 209.17
CB 5.59 -7.11 75 38.67
CH -6.58 6.52 82 225.42
CU -1.63 11.44 89 188.02
SL 5.35 4.56 82 131.19

Here is an average speed vs spin angle chart. I am borrowing Mike Fast's method on this, with his permission of course. If you would like more information on this subject, read his great post about it here: http://fastballs.wordpress.com/2007/09/07/magnus-papelbonus/


Blanton is a five pitch guy and most pitches are fairly easy to distinguish. One interesting thing I found about Blanton is his cutter. While researching this article, I saw no mention of the fact that he throws a cutter. Neither Baseball Info Solutions or Inside Edge lists him with a cutter. But after looking at the pitch f/x data, it is fairly easy to see he does throw a cutter. As pitch f/x data becomes better utilized in the future, I wonder if this trend will continue. Finding pitches that can't be easily seen through television is a key factor in the continued development of this data.


These next three charts show his pitch selection by both count and pitch result. In terms of analyzing a pitcher, I find these more useful. But you can't get to this point without doing the above work.
Blanton by count


Blanton by result


PITCH CB CH CU FB SL
BABIP 0.225 0.267 0.275 0.198 0.333
Strike % 56.38% 67.11% 67.86% 65.37% 59.00%
Contact % 88.06% 84.62% 89.89% 92.35% 83.72%


Along with these two charts I have used before, for the first time I have calculated a pitchers BABIP and contact % by pitch type. In the future I hope to add slugging percentage and some other nice features.

The biggest thing I can take away from Joe Blanton's pitch f/x data is his lack of an out pitch. Look at his contact percentage. Contact percentage is simply the amount of times the hitter made contact divided by every time he swung. Having a contact percentage over 80 for each pitch he throws is alarming. For example, Chad Billingsley has a 58% contact rate on his curveball and a 64% rate on his slider.

Now with this said, that isn't necessarily a bad thing. But looking at his contact rate and BABIP together, we see that he has been fairly lucky so far. With a BABIP of .198 against his fastball along with a contact percentage of 92%, well all signs point to an increase of runs against.

In Oakland he has had a good fielding defense behind him. If he gets traded this summer, teams without a strong defense must be aware that he will struggle.

Saturday, May 24, 2008

5/24 Josh Beckett Preview

Tonight Josh Beckett starts vs the Athletics. In Beckett's last start, May 18th vs the Brewers, he got knocked around for 6 runs in 7 innings. His biggest problem in that game was the 4 home runs he gave up. Tonight, he will look to bounce back. Let us go back and take a look at his 5/18 start to see what we can find. Below is his pitch f/x data from that start:


Beckett struggled with his off speed pitches in this game. 3 of his 4 home runs came on his curveball while the other HR came off his changeup. Below is the location of all his curveballs he threw in the game as well as the changeup that Prince Fielder hit out.


As you can see, Beckett left a lot of curves in the middle of the zone. We can almost conclude from this pitch location chart that he was lucky not to get tagged for more runs. It seems that he was leaving his breaking ball over the heart of the plate.

Below is a chart showing the movement of his curveballs that got hit out.


As you can see, as the game went on, his curve lost both vertical and horizontal movement. By no means were these curves terrible, but you can see the progression as the game went on.

Look for Beckett to continue to pound the strike zone with his fastball. The key tonight will be his ability to keep the breaking ball down in the zone.

Friday, May 23, 2008

Rich Harden comes to town

For the first time in this blogs (short) history, I will take a look at another teams pitcher. Going forward, I will be doing this more often.

The Red Sox will be facing Rich Harden for the third time this year. Through their first two match ups, Harden has dominated. In 11 innings, he has given up 7 hits, 7 walks, 15 strikeouts and only one run. On the season, Rich Harden has 4 starts. Outside of his 5/11 start vs the Rangers, he has cruised: Game Log.

Baseball Info Solutions, where I did an internship, says Harden throws a Fastball, Slider, Changeup and Splitter. Four fairly distinct pitches, outside of the changeup and slider, that should be easy to chart. But the thing about Rich Harden is he throws everything hard. So hard that it is fairly tough to chart him with 95% accuracy. I have decided to try a program that runs a K-Means clustering algorithm for me to decipher his four pitches. I am fairly happy with the results:


This graph is the spin angle (Theta) vs start speed. Much thanks to Mike Fast for introducing me to this graphing method. The green is the fastball, the blue is the changeup the red is the slider and the orange is the splitter. Notice how closely packed the clusters are? That just shows how close his pitch types are. Understandably tough for a hitter to pick up the pitch movement. While this plot isn't perfect, it gives a good general idea of what he throws.

To look at Harden's vs the Red Sox in 2008, we only have his 4/2 start to look at. There was no f/x data for his start in Japan. Below is his pitch type by pitch count.

CountFBSLCHSFGrand Total
0020711644
011004014
10700310
11801110
1220002
2020002
2120002
3010001
3110001
Grand Total537161086

The only count that has a significant spread in pitch selection is 0-0. Outside of 0-0, pitch selection was fairly basic. Lots of fastballs and why not, when you can dial it up like Harden.

Here is Harden's fastball location from 4/2. In the zone and up in the zone.


Well it looks like Harden's strategy last time was here is my fastball, try and hit it. Lets see what kind of adjustments the Red Sox hitter's make tonight. After a long cross country trip, the bats might be a little slow tonight. If that is the case, Harden's fastball should dominate again.

Thursday, May 22, 2008

Quick Dice-K Preview

Here is a quick look at Daisuke Matsuzaka, who is starting todays game. I am fairly certain he throws more than 4 pitches, but here is a quick look at his pitch movement. When I have time, I will try and break him down further.


Tuesday, May 20, 2008

Jon Lester's No Hitter

So when I did the 5/19 pitcher preview of Jon Lester, I said he needed to use his changeup to be more effective. Well evaluating a no-hitter would be a great way to test that statement, wouldn't it? So let's dig in.

Average Pitch Movement
Pitch Type PFX_X PFX_Z SPEED
FB 5.49 8.02 92
CB -6.06 -4.00 78
SL -2.31 4.50 88
CH 6.83 7.68 84

These numbers are on point with his season averages. The biggest difference was the horizontal movement of his slider. Coming into this game, his slider pfx_x average was -1.5. Also notice that Lester's changeup doesn't have much vertical drop. In fact, it has about the same drop as his fastball. Moving forward, he will need to add more depth to the pitch if he wants to use it as an out pitch.Here is Lester's pitch type by count:

Count CB CH FB SL Grand Total
00 1 1 21 4 27
01 4 2 6 4 16
02 2 0 4 1 7
10 0 0 7 2 9
11 3 3 6 2 14
12 5 0 5 4 14
20 0 0 3 0 3
21 0 0 4 3 7
22 1 0 8 3 12
30 0 0 2 0 2
31 0 0 3 0 3
32 0 0 4 0 4
Grand Total 16 6 73 23 118

Notice the 1-1 count. Lester was not afraid to fall behind 2-1, as evidence by his pitch mix.

Here is the pitch results by pitch type:

Type CB CH FB SL Grand Total
Ball 7 4 23 7 41
Called Strike 3 1 16 1 21
Foul 3 1 12 7 23
In play, out(s) 2 0 14 2 18
Swinging Strike 0 0 8 6 14
Swinging Strike (Blocked) 1 0 0 0 1
Grand Total 16 6 73 23 118

Going back to the pitcher preview I did on 5/18, I said Lester would need to use his changeup to be more effective. Well as this chart shows, Lester decided against using his changeup completely. He only threw the pitch 4 times all game, instead relying on his fastball/slider combination. The 4 times Lester threw the changeup, he was either ahead or even in the count.

Finally, this last chart shows Lester's fastball speed throughout the game. In his post game comments, he said his adrenaline was pumping towards the end and that helped increase his velocity. This chart shows Lester indeed added velocity towards the end of the game:


Overall a great game by Jon Lester. He threw first pitch strikes to get ahead and battled back in the at bats where he got behind. As long as his slider continues to be as effective as it was tonight, there won't be an immediate need for the changeup. I would still like to see him throw it more going forward, if only as a show me pitch to change speeds.

Monday, May 19, 2008

5/20 Pitcher Preview

Justin Masterson vs KC

I will break down Jon Lester's no-hitter tomorrow, but for now lets look at tomorrow's starter. Justin Masterson is a young right hander making his second career start. Masterson is a classic sinkerball pitcher who throws from a 3/4th arm slot. He features a turbo sinker, 4 seam fastball, changeup and slurve. As you will see below, he threw his sinker 40% of the time.

Below are the results from his first start.

Average Pitch Movement

Pitch Type PFX_X PFX_Z SPEED
FB -8.49 4.91 90.73
SI -11.67 -0.70 89.18
CH -9.58 2.70 83.10
SL 2.50 0.52 81.60


Here are Masterson's pitches by result. One area that jumps out to me is the strike percentage on his slider. With 4 called strikes, 3 foul balls,4 swinging strikes and 2 outs, he recorded strikes over 50% of the time he threw the pitch. It will be interesting to see how he uses this pitch tomorrow. If he is not able to throw it for strikes, expect him to struggle.

Result CH FB SI SL Grand Total
Ball 2 9 18 8 37
Called Strike 2 3 6 4 15
Foul 1 6 6 3 16
Foul Bunt 1 0 0 0 1
In play, no out 0 0 1 0 1
In play, out(s) 5 3 3 2 13
In play, run(s) 0 0 0 1 1
Swinging Strike 2 0 4 4 10
Grand Total 13 21 38 22 94


This chart shows Masterson's sinker location from his first start. This graph is from the pitchers view. Notice how Masterson was not getting calls down and away to right handed hitters, or down and in to lefties. Lastly, Masterson was missing the zone to his throwing side. This is not uncommon for sinker ball pitchers. With all the movement on the sinker, it can be hard to pitch to the other side.


Sunday, May 18, 2008

5/19 Pitcher Preview

Jon Lester vs KC


CB CH FB SL Grand Total
Ball 41 16 191 59 307
Ball In Dirt 7 0 1 3 11
Called Strike 22 3 87 18 130
Foul 12 1 89 45 147
Foul (Runner Going) 0 0 5 0 5
Foul Bunt 0 0 1 0 1
Foul Tip 0 1 6 1 8
In play, no out 6 1 21 6 34
In play, out(s) 12 6 71 22 111
In play, run(s) 2 0 11 3 16
Swinging Strike 3 4 36 6 49
Swinging Strike (Blocked) 4 0 0 0 4
Grand Total 109 32 519 163 823


I believe Lester's slider is a mix between a slider and cutter. If I get time, I will try and break that pitch down some more. For now, lets just call it a slutter and move on.

The biggest thing that jumps out for me is the lack of swinging strikes that Lester has gotten. His changeup seems to be struggling also. He has only thrown it for a called strike 3 times out of 823 pitches. That is a terrible number. If he can't develop a better changeup, he is destined for the bullpen.


Please note that pitch f/x data isn't 100% accurate for total number of pitches. Some pitches are not recorded by the f/x system.